
Introduction
The SSTL S1-4 is a multispectral imaging satellite launched in 2018 which provides a GSD of sub 1m in the panchromatic band and <3.5m in the multispectral bands (Red, Green, Blue, NIR). One of the primary applications of multispectral satellite imagery is the monitoring of crops and the management of farmland. Satellites hold an advantage in this area over other crop management methods (such as aircraft imagery or on ground testing crop testing) due to the ability to get frequent and reliable radiometrically corrected data. Due to the SSTL S1-4’s low earth orbit (LEO) and its high agility (up to 45 degree off-pointing) it is able to revisit anywhere on the Earth every few days, on average, to provide regular updates on crop growth and health. This commercially available data covers wide areas and is available within hours of acquisition to provide valuable up to date information.
On this page we show examples of how the multispectral bands can be used for change detection and monitoring of an agricultural area. The area used for this case study is centred on Grand View, Idaho in the USA, specifically centred on 43.0 N, 116.1 W. Two images have been captured of the area, one towards the end of spring (9th May 2020) and the other at mid-summer (25th June 2020).
The primary advantages of change detection monitoring for agriculture are to:
- Track crop health and indicate when crops have been damaged. This can in turn be used to adjust watering and feeding cycles to maximise yield.
- Isolate areas of crop degradation which, when combined with ground data, can be used to quickly locate and isolate disease in crops.
- Estimate crop yields of a region. This is very useful, especially for developing countries to determine expected shortage or excess of certain crops, which can allow farms to focus on crops that will be in higher demand. Knowledge of the arable yield of a country also has large effects on the pricing of crops and the import and export needs of a country.
The satellite image below shows the analysis region. The area is mainly used for arable farming and utilises both classical rectangular fields (mainly located closer to Snake River), as well as centre-pivot irrigation.

Full sized image of Grand View, Idaho agricultural region acquired by SSTL S1-4 satellite 25th June 2020 at sub 1m GSD
Image Comparisons
To demonstrate the changes seen over the period we have chosen to zoom in on an area closer to the Snake River, an area with mainly rectangular fields and some centre pivot irrigation plots as you move away from the river.
RGB and False Colour images
The slider below shows 2 red, blue, green (RGB) colour bands images acquired in Spring and Mid-summer, showing an overall increase in vegetation .
RGB bands - time comparison:
Left image acquired May 2020; Right image acquired June 2020
As well as the red, green, and blue bands, the satellite's multispectral capability also includes a near infra-red (NIR) band, which collects light with wavelengths from 750-910 nm at the same resolution (3.48 m) and the image below shows how useful this NIR band can be. On the Left side of this slider we see the classical RGB image, while on the Right side we see the false colour image which is created using the NIR, red, and green bands. False colour images show bright red for photosynthesising crops which is an indication of healthy growth and can be very useful to determine crop growth and health especially when compared to historical data set samples of a healthy crop.
RGB band / False colour image comparison:
Left image - RGB band image
Right image - False colour image acquired using NIR + RGB
Regular False colour images are used to monitor crop growth, calculate fertiliser requirements, and produce crop yield predictions.
False colour images - time comparison
Left image - False colour image acquired May 2020
Right image - False colour image acquired June 2020
NDVI images
Another type of image that can be produced from the satellite's multispectral bands is the normalised difference vegetation index (NDVI). This is an index scale which ranges from -1 to +1 and can be used to classify regions of the image in terms of crop health.
NDVI scale images - time comparison
Left image acquired May 2020
Right image acquired June 2020
The NDVI scaling is shown in the table below along with the colour mapping we have applied to these images.
|
|
|

NDVI Scale
NDVI difference map
From the NDVI images we can also do a mathematical comparison of the two time periods by subtracting the two NDVI images. This results in the image below, where red indicates new crop growth and blue represents a decrease in crops.

NDVI difference map
SSTL S1-4 satellite
The SSTL S1-4 satellite has a mass of 440kg and is capable of acquiring multiple targets in one pass and utilises spot, strip and mosaic imaging modes and 45 degree off-pointing agility for a range of applications including urban planning, agricultural monitoring, land classification, natural resource management and disaster monitoring. The very high resolution imager on board the spacecraft was designed and manufactured by SSTL and acquires sub 1 metre resolution images in panchromatic mode and sub 4 metre resolution images in multispectral mode, with a swath width of about 20.8km.
Data capacity from the satellite is leased to Airbus and Twenty First Century Aerospace Technology Co Ltd (21AT).
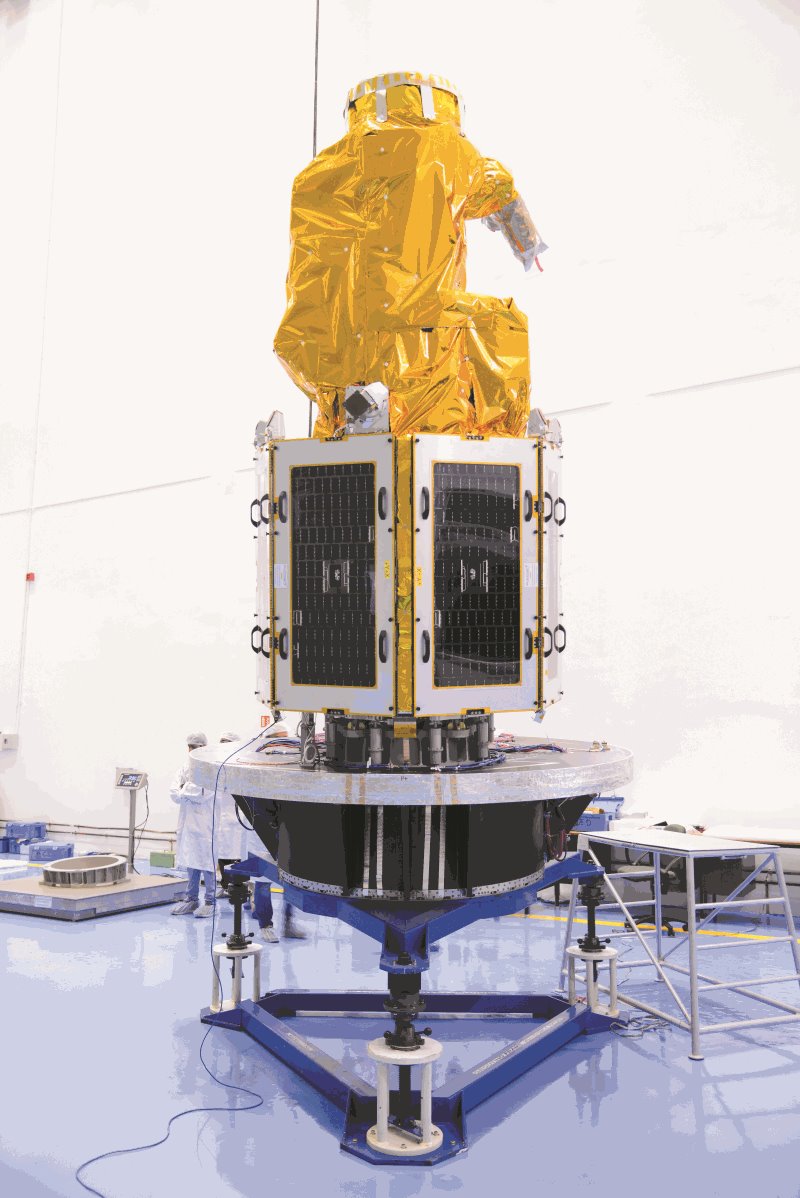 SSTL S1-4 satellite 2018